


Prepared by Specim Hyperspectral
The quantification of moisture is critical for many industrial and research applications. Quantitative models based on spectroscopy are efficient, non-destructive, and accurate for monitoring the moisture content. Hyperspectral cameras also reveal the spatial distribution of moisture, whereas point spectrometers provide only general distribution. In this study, Specim Hyperspectral monitored the moisture content of a cotton patch along with its drying.
NIR = NEAR INFRARED (900 – 1700 nm)
PLS = PARTIAL LEAST SQUARE
PLS DA = PARTIAL LEAST SQUARE DISCRIMINANT ANALYSIS
WATER ABSORPTION PEAKS IN THE NIR SPECTRAL RANGE
Monitoring the moisture in production is critical, for example, in the food, paper, and wood industries. Near-infrared (NIR) spectroscopy is widely used to monitor moisture content in various applications.
Spectroscopists rely on water absorption peaks being part of the NIR spectral range. As shown below, water strongly absorbs light at 970, 1150, and 1450 nanometers. The Specim FX17 camera’s spectral range covering 900 – 1700 nm is perfect for detecting water absorption peaks. Besides providing relevant data for moisture quantification, the spatial dimension embedded along with the hyperspectral images also reveals the moisture distribution.
In this study, Specim Hyperspectral monitored and quantified the drying time of a cotton patch. They dipped a round cotton pad of ca. 5 cm (typically used to remove makeup) into the water and then applied it on the Specim lab scanner 40×20. They then monitored its drying with Specim FX17 hyperspectral camera and took measurements every 4th minute until it dried completely. It required all together sixty-seven (67) measurements over 264 minutes. Specim analysed the data with SpecimINSIGHT software.
SPECTRAL ANALYSIS OF THE DRYING COTTON PADS
Each image was first normalised with respect to dark and white references. Then a mosaic was created by combining all 67 images acquired over the time of the experiment into a single file. This mosaic depicts the cotton pad at different drying stages, starting at the top right when it was very wet and dry on the bottom right. The mosaic was filled row after row, from left to right, from top to bottom.
As shown in Fig.1A, a clear gradient from the false RGB mosaic image can be seen after the drying process. Spectra reveal the same trend: those related to the wet samples show the deepest spectral absorption at 970, 1150, and 1420 nm, whereas those peaks vanish along with the drying time. An acceleration of the drying is also noticeable after 3.5 hours (over the last ten measurements).
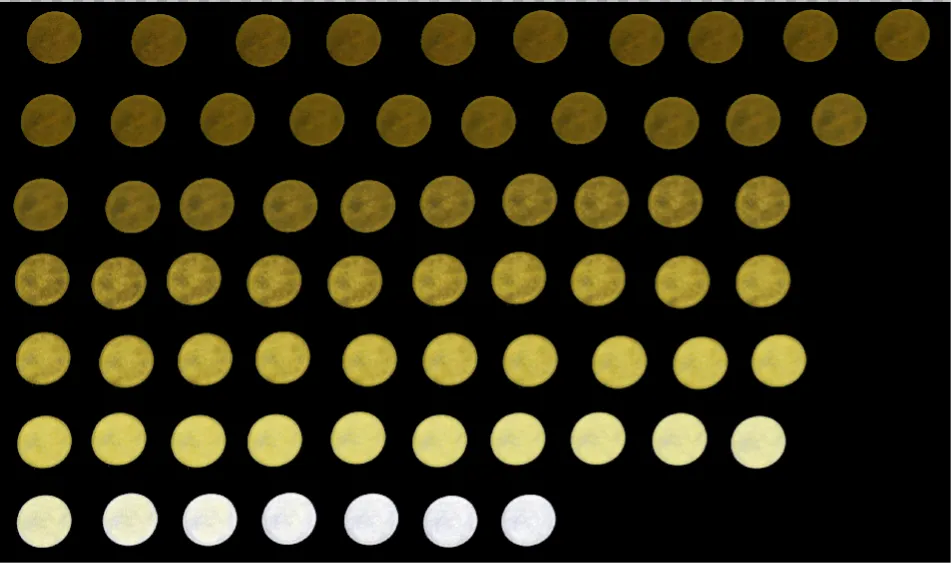
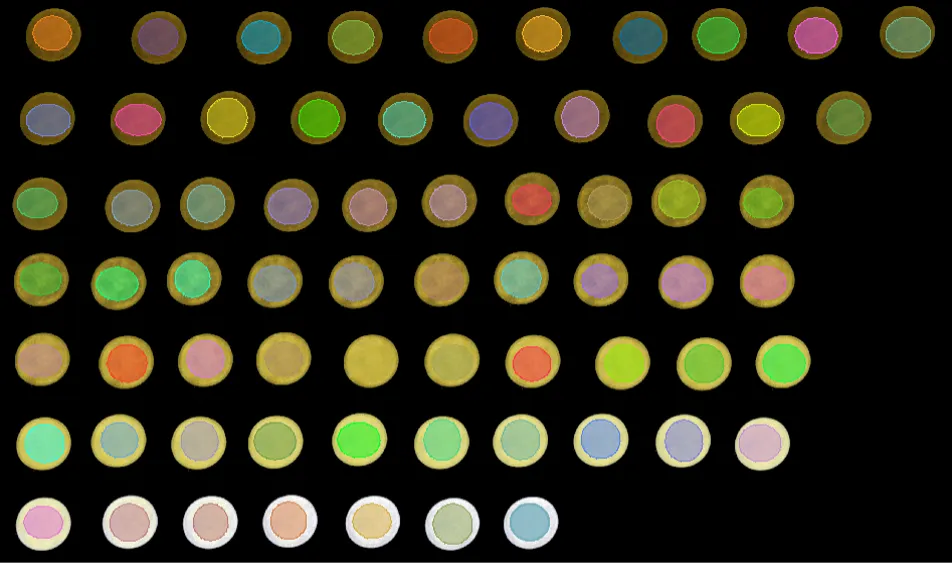
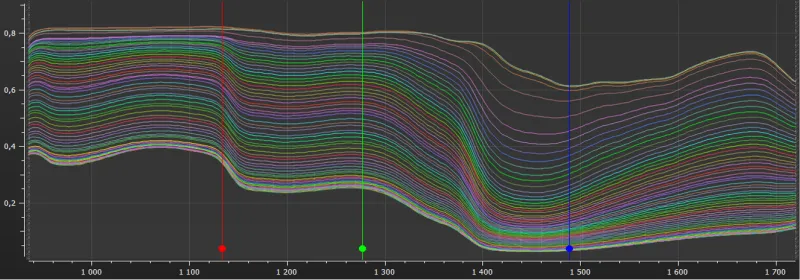
Figure 1: False RGB and NIR spectra related to the drying of the cotton pad.
MODELING – PLS REGRESSION
A PLS regression was built to quantify the drying level of the cotton pad. The regression variable was called “drying,” ranging from 0 to 264 (corresponding to the drying time in minutes). Notice that with SpecimINSIGHT, the regression can be built on samples only, regardless of the background. For training the model, every second image was taken into account. The accuracy of the model was estimated on all other images.
The predictive performance of the regression is presented in Fig.2. For each cotton pad, we produced a heat map representing the drying, highlighting the relevance of hyperspectral imaging to depict variable distribution. The built model had very high accuracy, with an R2 of 0.98. Looking at the actual vs. predicted values, the drying on very wet cotton was more challenging to quantify. The spectra of Fig.1C correlate with this, showing that at the beginning of the drying, only slight variation is observed in the depth of the absorption peaks related to water.
Sepcim built a second model, similar to the one presented before, but this time on 61 images acquired every second minute. The R2 was here at 0.97. In this second model, focusing more on wet samples, the actual vs. the predicted values show that the second model is more accurate at the beginning of the drying process. This highlights that depending on the samples and their moisture level, the choice of the training samples is crucial to building an accurate model.
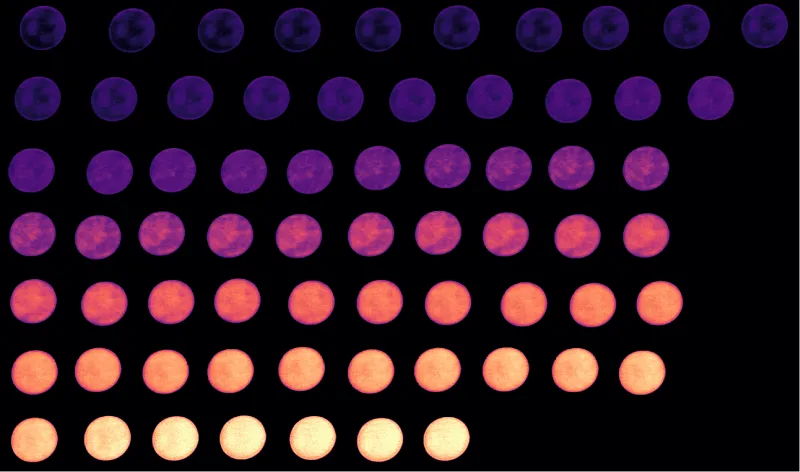
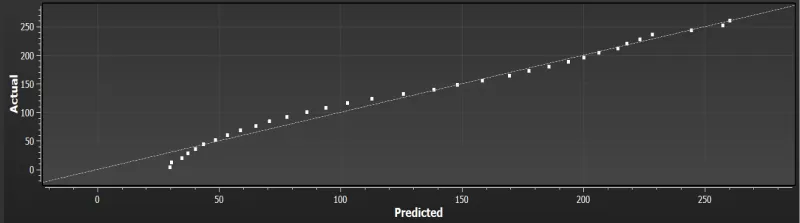
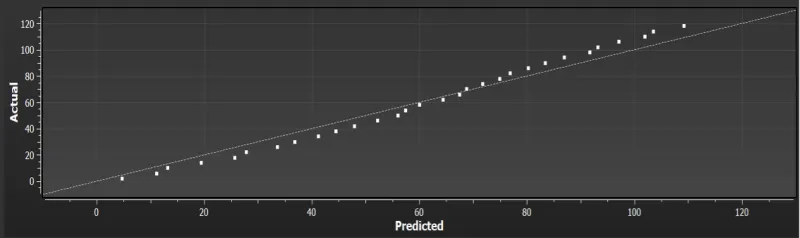
Figure 2: Predictive performance of the “drying” regression models.
CONCLUSION
The Specim FX17 is suitable for accurately quantifying samples’ moisture level, here a cotton pad. Also, SpecimINSIHGT is a relevant software to perform such analysis and build an appropriate regression model. Those models can be loaded into SpecimCUBE for real-time quantification.
Finally, this study shows that the choice of the training sample strongly affects the predictive performance of the models.
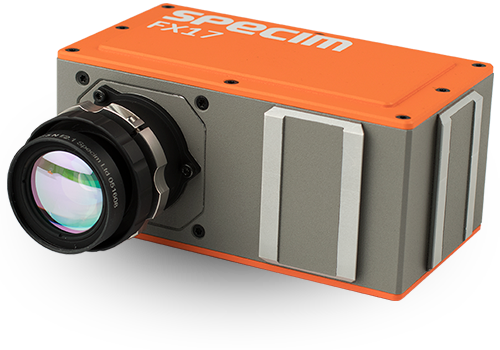
The FX17 is a small footprint hyperspectral camera built around an InGaAs detector. It operates in the NIR spectral range (900-1700 nm)

Do you have any questions about your application?
Contact our Technical Sales Manager, Dr. Luke Nicholls by email or call (01372) 378822.
Disclaimer
Our partners, Specim, Spectral Imaging Ltd. prepared this technical note and it is for general guidance only. They keep all the rights to modify the content.


