


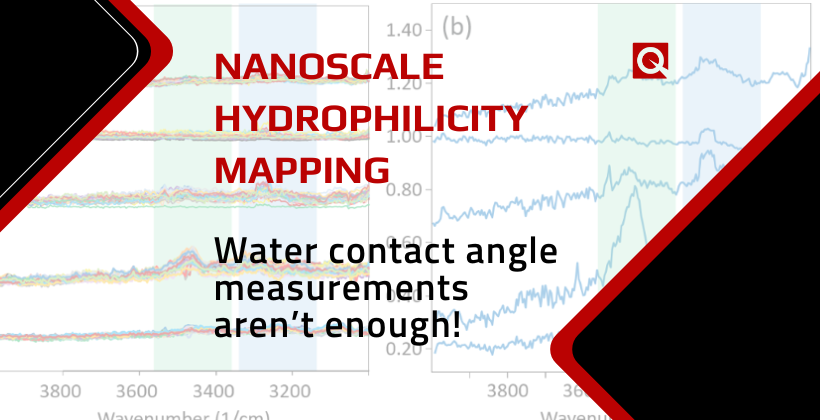
Water contact angle measurements aren’t enough!
Measurement of -OH termination on hydrophilic surfaces

Background
For successful Cu-Cu hybrid bonding to occur in the most demanding advanced packaging, the two mating dielectric surfaces, in many cases silicon oxide, must bond effectively at low temperatures. It is known that hydrophilic silicon wafers can be bonded together easily at room temperature [1]. Hydrophilic silicon surfaces are usually realised by Si-OH termination. However, detecting if a surface is properly prepared can be quite difficult. A less the 0.6 nm layer of physisorbed water has been successfully measured on a clean silicon surface at ~40% relative humidity. This measurement was accomplished by using a silicon substrate as an attenuated total reflection (ATR) crystal, which was prepared so that there would be ~ 35 internal reflections to help increase the SNR [2]. While impressive, this method of measurement isn’t practical for routine measurements. It also is a macroscopic technique averaging over hundreds of microns of sample surface. Another widely used macroscopic technique is a water contact angle measurement. However, it has been shown that there are significant differences between the macroscopic and microscopic hydrophobicity (measured by water contact angle) when there is inhomogeneity on the surface [3]. None of the traditional analytical techniques (EDX, ToF-SIMS, etc.) can reliably detect the presence of such a thin water layer locally. In this note, PiF-IR spectra are used to follow the adsorption and desorption of water molecules as a silicon surface undergoes cleaning and heating procedures.
Experimental
28 PiF-IR spectra are acquired in a 7 × 4 grid pattern over a 2 µm × 1 µm area. Each spectrum took 20 seconds to acquire. The same tip and the same laser power were used to remove any experimental variability. The same sample was measured at five different conditions: (1) as is, before any cleaning; (2) at room temperature after UV ozone cleaning; (3) at 50 °C; (4) at 80 °C; and (5) after cooling back down to room temperature. Measurements for conditions 2 through 5 were conducted with minimal waiting between the measurements. All the measurements were conducted with a constant flow of dry air in the measurement chamber.
Results and Discussion
In Figure 1, we plot the PiF-IR spectra acquired at five different conditions. Figure 1a shows all 28 spectra at each condition whereas Figure 1b shows the average spectra at each condition at magnified y-scale. In the figure, we also show the -OH spectral locations associated with two different kinds of water layers that form on a silicon surface: an ice-like water layer that forms on the surface of the silicon via hydrogen bonding with Si-OH and the loosely-bound amorphous layer that forms on the surface of the ice-like water layer [2]. The spectral region associated with the ice-like layer is shown shaded with a blue tint, and the region associated with the amorphous layer is highlighted with a green tint.
The bottom most spectra are from a silicon coupon without any cleaning (“as-is”). From Figure 1a, we can see that the spectra from 28 different locations are quite repeatable and show broad peaks at the wavenumbers associated with both ice-like and amorphous water layers, albeit with weak IR peak strengths, indicating a less dense network of water molecules; the average spectrum shown in panel (b) shows the two broad peaks more clearly.

The group second from the bottom is associated with condition (2) where the silicon sample underwent a UV ozone cleaning for 15 minutes. As noted earlier, the measurements are made with the same tip and the same laser power to ensure direct comparison of the spectra for different conditions. Note that the broad peaks for both water types increase significantly from the “as-is” condition, most easily seen in panel (b), indicating a much denser network of physisorbed water. From panel (a), we can see that the spectra from different locations are not as repeatable, which indicates that the UV ozone cleaning process does not produce uniform surface, at least at the sub-5nm length scale, which is the spatial resolution of PiF-IR.
To lend more creditability that we are measuring the OH vibrations from the physisorbed water layers, we also repeated the measurements at elevated temperatures. From the literature, we anticipate the amorphous water layer to be more loosely bound and thus easier to remove at lower temperatures than the ice-like layer.
The first test at elevated temperatures was performed at 50ºC. The group of spectra for this test are third from the bottom in Figure 1. In order to capture the effect of heating, an effort was made to raise the temperature quickly and to start acquiring the PiF-IR spectra as quickly as possible (~ 1 minute between the measurement at the room temperature and the start of measurements at 50°C). From the average spectrum (in panel (b)), we can see that indeed the broad peak associated with the loosely bound amorphous water layer in the green shaded range decreases sharply compared to the broad peak associated with the ice-like water layer in the blue shaded range. Even though our measurements are not taken fast enough to capture dynamics, we can see the stochastic nature of the water desorption process, nonetheless.

In Figure 2a, we show the first 14 PiF-IR spectra acquired at 14 different locations on the sample at 50°C. The first spectrum is at the bottom of the plot, and each subsequent PiF-IR spectrum is acquired in roughly 20 seconds later at a different location and plotted on top of the previous spectrum. Therefore, Figure 2 shows the temporal progression of the measurement as we move from bottom to top. Somewhat as expected, the broad peak associated with the amorphous water layer starts strong initially and then gets weaker with passing time whereas the peak associated with the ice-like water remains relatively strong throughout, even as the peak shape changes slightly.
Right after the measurements at 50°C were completed, the sample was heated to 80°C and more PiF-IR spectra were immediately acquired. There was less than 1 minute between the measurement at 50°C and the start of the measurements at 80°C. These spectra are shown in the group fourth from the bottom in Figure 1. In these spectra, there is no evidence of the loosely bound amorphous water layer. There is, however, a small peak for the ice-like water layer. When we look at the individual PiF-IR spectra in sequence to see the time progression (Figure 2b), we see a flat IR signal at most locations. These flat spectra indicate that there is no water layer on the surface at those locations, neither the ice-like nor amorphous layer. At only at a few locations, there is an IR signature that could indicate the presence of some ice-like water on the surface. This is consistent with the fact that the ice-like water layer is held more tightly with the substrate, so traces of this layer are still present at this higher temperature.
When the sample is cooled back down to the room temperature, water molecules from the ambient physisorbs onto the surface again. The PiF-IR spectra associated with this condition is seen at the top of the plot in Figure 1. They resemble the spectra associated with the as-is silicon substrate that had not undergone any cleaning, which is a reasonable outcome considering that the heating experiment was conducted in an unclean environment (i.e., not HV or UHV environment).
Conclusion
IR PiFM can chemically identify the presence of both ice-like and amorphous water layers on hydrophilic surfaces with good SNR; even a single 20-second spectrum can provide unambiguous IR signature associated with -OH bonds, which should prove to be invaluable to characterise surface treatments for many diverse applications.
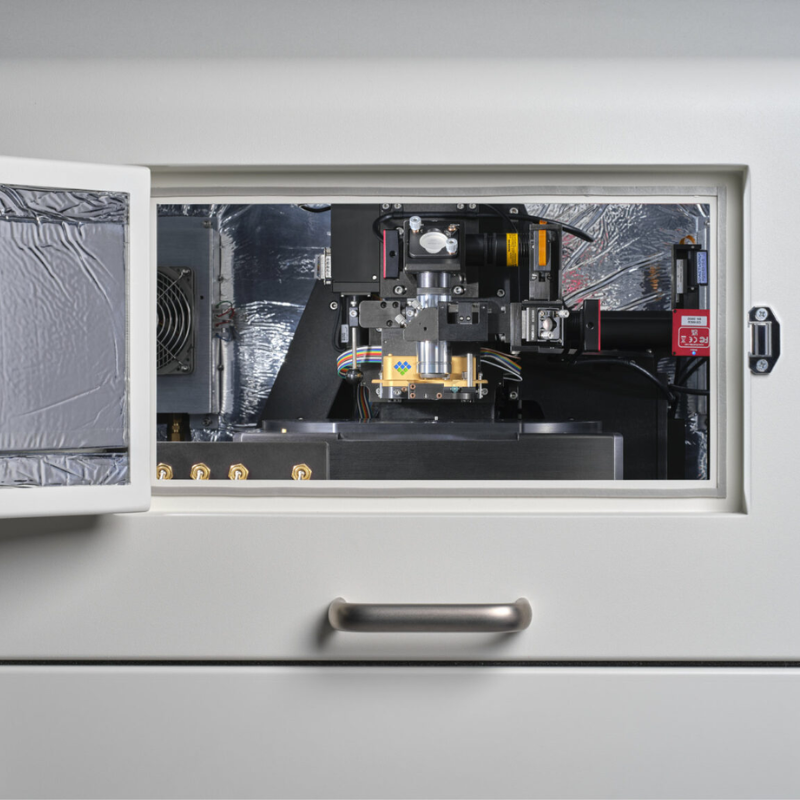
Molecular Vista manufactures nano‑IR microscopes and develops PiFM and PiF-IR microscopy and spectroscopy. One billion times better than FTIR* – Get nano‑IR spectra to understand nanomaterials at a level unattainable with conventional FTIR techniques.

To discuss the characterisation of your surface treatment processes…
Contact Dr. Shayz Ikram, Technical Director by email below or call (01372) 378822.


