


Had a problem with centring your sample from your data?
Mounting point differences
- PPMS® VSM: mounting point is 35mm from the bottom of the sample holder
- ACMS 2 option: the mounting point is at 25mm from the bottom of the sample holder due to the coil set construction
This is a common point of confusion for customers with both systems. If you mount the ACMS 2 sample at 35mm, you cannot centre the sample in the bottom part of the gradiometer as the sample holder will hit the coil set.
On the MPMS®3 the mounting point is 66mm from the bottom of the sample holder, as along with the SQUID VSM mode, customers also like to use a DC scan where the sample will move by 35-40mm or so, and you must avoid scanning the ends of the sample holder as they produce “end effects” which can appear as magnetic.
These are “sample coordinates” in the system and the sample mounting station is there to make it easy by providing a reference point.
You then install your sample in the system and run the sample install wizard.
Sample install process in the system
- Sample is installed, and moved through the gradiometer
- The system looks for a peak, fits it, and reads out the centre position of the sample
- Ideally 35mm for the PPMS VSM
- 25mm for the ACMS 2
- 66mm for the MPMS 3
- If the systems reads out a different centre position that expected this is an indicator of a problem
Focusing only on the MPMS 3 as an example:
Say you mounted your sample at exactly 66mm and the system reads out 75mm, you should consider this a red flag. Don’t always trust the automatic sample centring.
This indicates the system is registering something else as the sample; for example, if there are any residual old magnetic impurities on the quartz paddle this could cause this mismatch.
This centre position reading therefore gives you a good sanity check to make sure your sample is mounted and centred properly.
Motor coordinates vs sample coordinates
If you open up one of the .dat files, you can plot a field called “Centre position”. This position is in “Motor coordinates” which are different to the “Sample coordinates” used above when centring the sample.
In the linear transport motor used on all 3 systems, 0mm corresponds to the bottom of the motor and 70mm corresponds to the top (and hence 35mm in the middle)
Therefore in each system the ideal sample centre position in motor coordinates is different
For the MPMS 3 using a standard sample holder or a straw cut to the same length, you’d want the sample to be at 35mm in motor coordinates such that you have the maximum amount of space for it to move in either direction.
For a SQUID VSM scan the maximum amplitude is 8mm and hence 16mm of total movement, and hence unless you’re right at either end of the motor you should not have problems.
However, for a DC scan, if the sample is not centred properly on the motor, the motor may reach its limit and interrupt the scan.
Customer data analysis
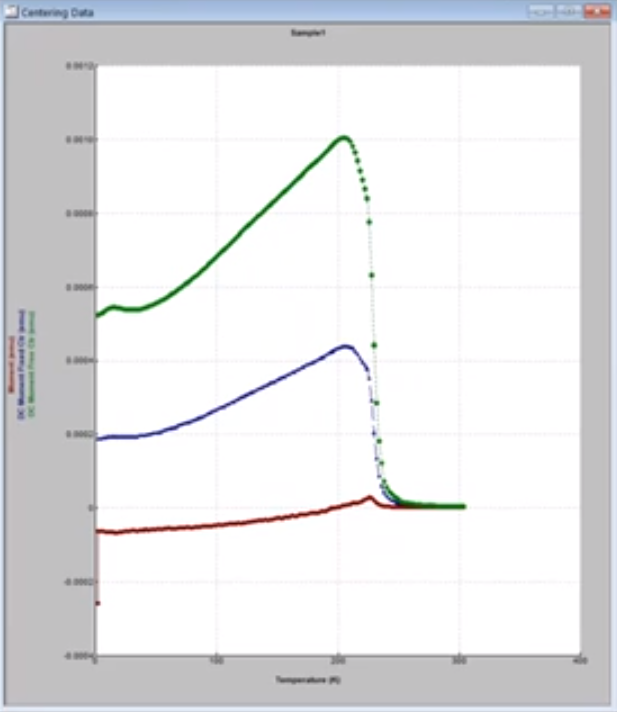
A customer sent QD some suspicious looking centring data. The Y axis is magnetic moment, and the X axis is temperature. This image is for the SQUID VSM measurement.
This instrument has both SQUID VSM and DC scan modes, and they measured both.
SQUID VSM mode has a higher sensitivity and allows the sample to remain in a more uniform field and temperature, however it has some potential pitfalls.
The customer noticed the moment they measured was very small compared to what they expected. They also noticed it went from a positive moment to a negative moment at approximately 200K.
They then looked at the DC scan data. The voltage waveform output is fit in two ways: once assuming the centre location from the original centring is fixed, and once assuming it to be free and allowing the system to track it. The free centre fit is in green, the fixed centre fit is in blue and the SQUID VSM fit is in red. The question is which fit is right?
Which fit is right?
- The fact they are so different in the first place is a big red flag that something is wrong.
- The DC moment free centre fit has the biggest moment, but that does not necessarily mean it is correct.
To check the fit quality you can look at two parameters called DC fixed fit and DC free fit (as opposed to “DC Fixed centre fit”). These are parameters between 0 and 1 where 1 indicates a perfect fit to the wave form and 0 indicates no fit at all. The top graph shows the DC free centre fit in blue, and the fixed centre fit in red. The bottom graph shows the “free fit” parameter in blue, and the “fixed fit” parameter in red.
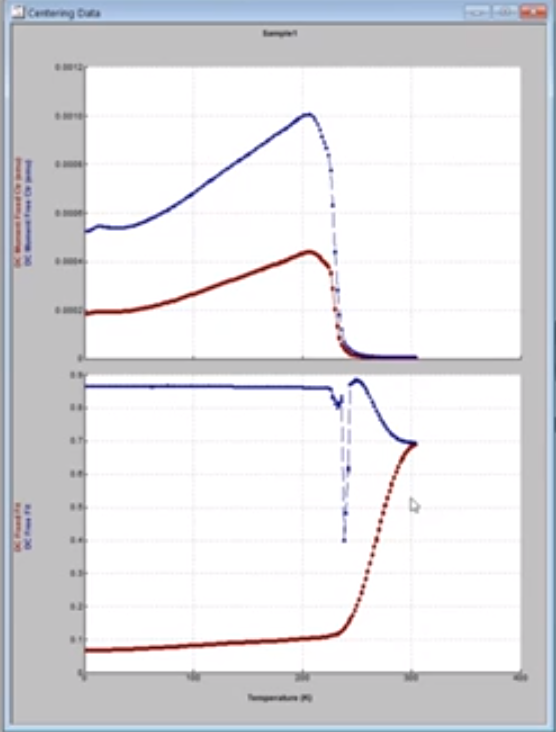
- Generally if the fixed fit or free fit parameters are below 0.85 the data should be considered suspect and investigated further.
- The fixed fit (bottom graph in red) starts at 0.7 at high temperature (right hand side of graph), which is suspect, but rapidly drops to almost no proper fit at lower temperatures.
- The free fit data however, remains above 0.8 for most of the time, and only drops a little below at high temperatures. It is therefore in this case much more trustworthy.
- This implies the data is more trustworthy when the system is tracking the centre position vs assuming it is fixed, and hence it is likely the issue is related to the centring of the sample.
- Plotting the “centre position” and the “calculated centre position” fields (in red and blue respectively, corresponding to the fixed and free centre fits respectively) allows the problem to be identified.
- The fixed centre fit is in red is too high by around 4mm. In motor coordinates the sample should be located at 35±1mm and this can be seen in the free centre fit in red. The system therefore thought the sample was too low when centring it in sample coordinates, even thought in reality it was centred at 35mm
- The SQUID VSM data also uses the fixed centre position, hence why it also seems incorrect.
Looking at the raw data also allows us to identify some of this:
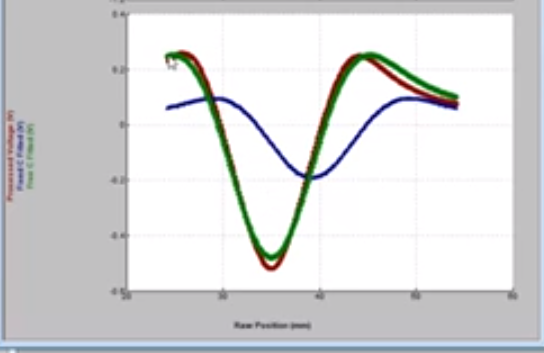
- The red line is the processed voltage from the pickups, the green line is the free center fit and the blue line is the fixed center fit.
- The blue line clearly does not fit to the data at all while the free center fit tracks it well.
- In this case the sample was close enough to the center position for the free center to compensate.
- If the sample was even further off the free center fit may not have been able to pick up enough of the actual waveform and also reported incorrect values, so you cannot always trust free center fit either.
- Overall you get a bandwidth of about ±5mm. Outside of this even the free center fit will begin to fail.
- The key here is to inspect your raw data curves.
Diagnosis
The customer seemingly did everything right – they had their sample mounted in an appropriate length straw, right at the 66mm mark of their mounting station.
However, when looking closely at a picture of the sample there was a little green dot from a marker pen on the straw.
The sample in question was not very magnetic at room temperature, and it turns out at room temperature the ink in the green dot was more magnetic than or similarly magnetic as the sample itself which was throwing off the centre location.
Comments
- When the customer centred their sample, they knew it was at 66mm in the sample holder, and saw 60-something mm and thought they were all good, however the 4mm made a huge difference.
- If the position is out even by a small bit, the SQUID VSM mode will vibrate around the “linear” part of the raw data curve above, rather than the parabolic trough, and hence will not pick up a strong moment, which is what we saw here.
- The key takeaways here are to be careful with your centring processes as you can throw off your entire measurement if you are not careful, and also to be careful with your sample preparation as even a tiny dot of green ink can be picked up by the magnetometer in these Quantum Design systems!


