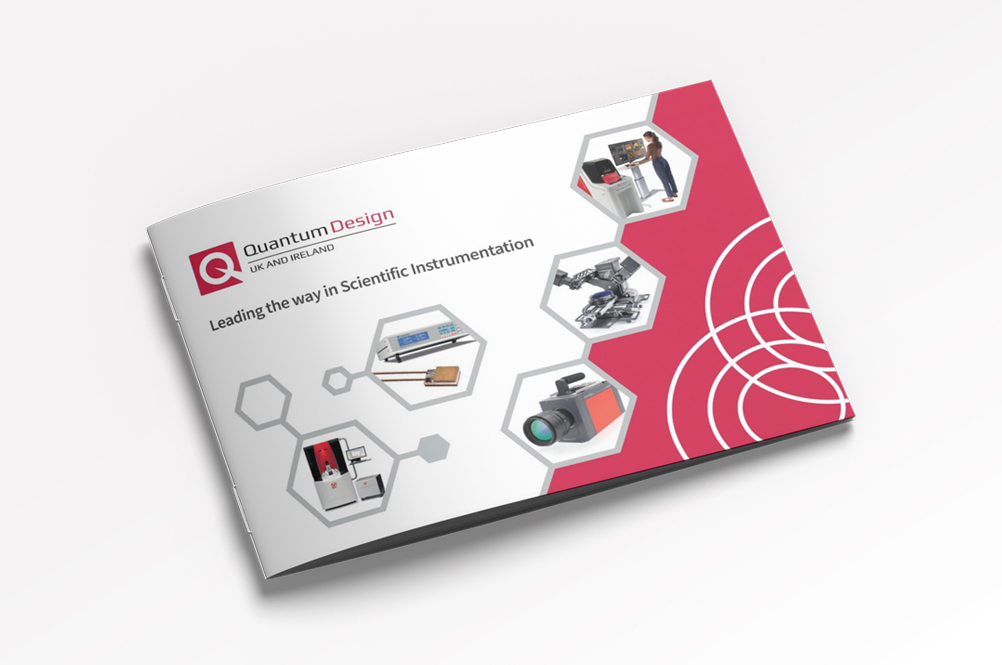
FusionScope™ from QD Microscopy

Easy to use Correlative AFM/SEM Microscopy Platform

FusionScope is an easy-to-use correlative microscopy platform designed from the ground up to add the benefits of SEM imaging to a wide range of AFM measurement techniques.

Combine the complementary strengths of AFM and SEM like never before! The FusionScope fully integrates a wide range of advanced AFM measurement techniques with the benefits of SEM imaging. Seamlessly image your sample, identify areas of interest, measure your sample, and combine your imaging data in real time.

Acquire detailed Material Characterisation of your samples, including structural, mechanical, electrical, and magnetic properties. Carry out high-level Quality Control of manufactured parts or perform Failure Analysis on electrical components or semiconductor devices. Easily characterise Nanostructures such as nanowires, 2D-materials, and nanoparticles. FusionScope gives you full control to locate your area of interest, position your probe, and perform a wide range of measurements.

FEATURES

  • Material Characterisation
  • Quality Control
  • Failure Analysis
  • Nanostructures
Profile
David Want Quantum Design UK and Ireland
Name

DAVID WANT

Job Title

Product Specialist

Phone
Email
Profile
Name

TECHNICAL SALES TEAM

Job Title

Support Team

Phone
Email
Profile
Name

ASHLEY CRANE

Job Title

Sales Manager

Phone
Email
Profile
Dr Jordan Thompson Quantum Design UK and Ireland
Name

JORDAN THOMPSON

Job Title

Service Engineer

Phone
Email
Profile
Quantum Design UK and Ireland Dr Shayz Ikram
Name

DR SHAYZ IKRAM

Job Title

Product Specialist

Phone
Email
Profile
Name

JOSH HOOK

Job Title

Sales/Service Support Engineer

Phone
Email
Profile

Name

LUKE NICHOLLS

Job Title

Technical Sales Engineer

Phone

+44 (0)1372 378822

Email

luke@qd-uki.co.uk

Static Mode (Contact Mode)

In static mode, or contact mode, the tip is in continuous contact with the surface of the sample and follows the topography closely in the repulsive regime. Typically, the cantilever is operated in deflection feedback mode. The set cantilever deflection relates to how hard the tip pushes against the surface and therefore determines the force load between tip and sample. For contact mode, long and soft cantilevers with lower force constants typically are used.

(Figures 1 and 2) AFM image of a polymer surface obtained in contact mode.
 

Dynamic Mode

In dynamic mode, also called intermittent contact or tapping mode, the cantilever is oscillated near its resonance frequency. When the tip comes close to the surface, the interaction between the tip and the sample causes the amplitude of the oscillation to change. As the cantilever is scanning over the sample, the height is adjusted to maintain a set cantilever oscillation amplitude. An AFM image is therefore produced by imaging the force of the intermittent contacts of the tip with the surface. The user can fine tune the interaction between the tip and the sample working in both attractive and repulsive regimes. Since this interaction with the surface is rather gentle compared to static imaging mode, it can better preserve the sharpness of the AFM tip.

(Figure 1) Correlative SEM and AFM topography image of freestanding graphene membranes measured in dynamic mode.
(Figure 2) High resolution AFM topography image of a single free-standing graphene membrane.

FIRE Mode

The Finite Impulse Response Excitation (FIRE) mode is a novel off-resonance intermittent contact scanning force microscopy technique. The FIRE mode is based on the observation of the cantilever signal in a frequency domain that is above the drive frequency but below the resonant frequency of the cantilever. The drive is provided by periodic excitation of the Z-flexure, which brings the cantilever tip periodically into contact with the sample. Comparison of the excitation profile to the cantilever deflection allows the gate array electronics to extract sample stiffness and tip adhesion in real time. Using this technique, when the tip is at a distance from the sample, background signals due to long range interactions can be measured and subsequentially subtracted from the measurements.

(Figure 1) AFM topography image measured with FIRE mode of two component polymer sample (polystyrene and polyolefin elastomer).
(Figure 2) Corresponding stiffness measured with FIRE mode of two component polymer sample (polystyrene and polyolefin elastomer).

Conductive AFM

Standard Conductive AFM (C-AFM) works in static or contact mode by simultaneously measuring the sample topography and the conductive properties of the sample using a sharp conductive tip. The cantilever tip is in constant contact with the surface while applying a defined bias voltage between the tip and the sample and measuring the current flow. In this way a current or conductivity map of the surface can be created. In addition, single point IV curves can be recorded to probe the detailed electrical properties at user defined positions.

(Figure 1) SEM image of Au electrode structure on silicon substrate.
(Figure 2) AFM topography image of electrode structure.
(Figure 3) Conductivity map of electrode structure.

Electrostatic Force Microscopy (EFM)

Electrostatic Force Microscopy (EFM) is a phase imaging mode used to study imaging variations in the electric field of the sample substrate and therefore study the surface potential and charge distribution. The EFM mode is the electrical equivalent to Magnetic Force Microscopy (MFM). Like MFM, the EFM measurement is typically done in a two-pass procedure. First the AFM tip is in contact with the surface measuring the topography in dynamic mode. Then in the second pass the tip is lifted by a user defined value (typically ranging from a few to tens of nm) and follows the topography of the surface in lift-mode. During the second pass a DC bias is applied between the conductive cantilever tip and the sample enabling the measurement of the long-range electrostatic interaction forces in combination with the sample topography.

(Figure 1) SEM image of BaTiO3 ceramic showing different grain boundaries.
(Figure 1) SEM image of BaTiO3 ceramic showing different grain boundaries.
(Figure 2) AFM topography image of BaTiO3 ceramic.
(Figure 2) AFM topography image of BaTiO3 ceramic.
(Figure 3) EFM phase image of BaTiO3 ceramic using +1.5V bias voltage.
(Figure 3) EFM phase image of BaTiO3 ceramic using +1.5V bias voltage.

Magnetic Force Microscopy

Magnetic Force Microscopy (MFM) is a phase imaging mode used to study the properties of magnetic materials using a magnetic AFM tip. The tip of the cantilever in atomic force microscopy generally experiences forces originating from the surface of the sample being measured. As a result, the structures shown are a product of the physical topography of the sample surface. However, by using different cantilevers, other characteristics of the sample can be detected and measured.

The simplest method to do this is a two-step procedure. The tip is drawn across the sample line by line and each of the two steps is applied to each line. In the first step, the topography of the sample surface is measured “normally” in AFM mode. In the second step, the same line of the sample is measured again, but the topography of the surface is traced at a defined distance above the surface so that phase shift and amplitude can be recorded.

Due to the distance to the surface, the tip of the cantilever experiences no interactions with short-range forces of the surface in the second step, but only with long-range forces that are still “visible” at this distance. Long-range forces are, for example, magnetic interactions. If the cantilever used has a permanent magnetic tip, these magnetic interactions can be mapped with this method.

(Figure 1) AFM topography image (dynamic mode) of a multilayer Pt/Co/Ta sample.
(Figure 2) Magnetic Force Microscopy (MFM) of the same area.

SEM (Scanning Electron Microscopy)

Using its focused electron beam, FusionScope can achieve high-resolution topographic imaging from the surface of your sample. In fact, with its highly surface-sensitive SE mode, FusionScope can collect topographic information from within a few nanometers of the surface.

How does FusionScope obtain this information? Through the use of Secondary Electrons (SE), which are lower energy (< 50 eV) electrons that have a limited escape depth (< 2nm). Thus, only the ones from the sample surface manage to emerge from the material. This allows for achieving very high topographic resolution in the SE mode with low beam energies (< 10 kV), with the additional benefit of reducing the damage caused by high energy beams. Since the SE yield (emission rate) is high, this mode also provides a better signal-to-noise ratio (SNR). Overall, this mode offers a good compromise of high resolution, fast and non-destructive imaging for dimensional analysis.

(Figure 1) SEM micrograph of tin spheres on carbon layer. Image horizontal field width is 50 µm.
(Figure 2) A high magnification micrograph reveals the details of the marked surface of the broken tin ball from Figure 1.

Additional SEM Features Include:

  • Ease of navigation with very high-resolution imaging due to FusionScope’s millimeter-to-nanometer scan range capability
  • Advanced automated functions for sharp and crisp images for users at any skill level
  • Up to 80° tilt with Profile View reveals additional “side” features of samples and allows for cross-sectional images
  • Probe current measuring by integrated Faraday Cup interface
  • Automation via the power and versatility of Python scripting
  • Multiple beam-defining orifice options allow the operator to select different beam currents on-demand
  • High frame rates allow live SEM imaging
  • Rapid analysis for application areas for Bio and Medical Sciences, Ceramics, Quality Control, Failure Analysis, Forensics Investigations, Life Sciences, and Semiconductor Inspection

VIDEOS

Downloads

Supplier Info

For even more information, why not visit our suppliers website.

Visit website

Follow us:


Keep up to date with our latest product news and developments. Join our mailing list

Top