


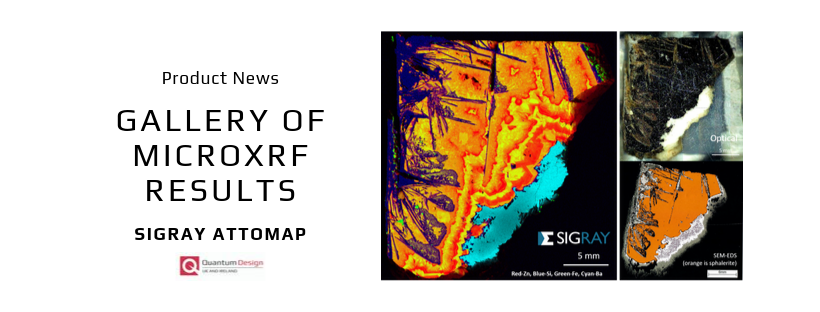
The powerful sensitivity and high resolution of the AttoMap produces synchrotron-quality elemental distribution mapping of trace elements for a wide range of research applications, spanning from the life and materials sciences to industrial use for pharmaceuticals, natural resources (oil and gas, mining), and semiconductor failure analysis.
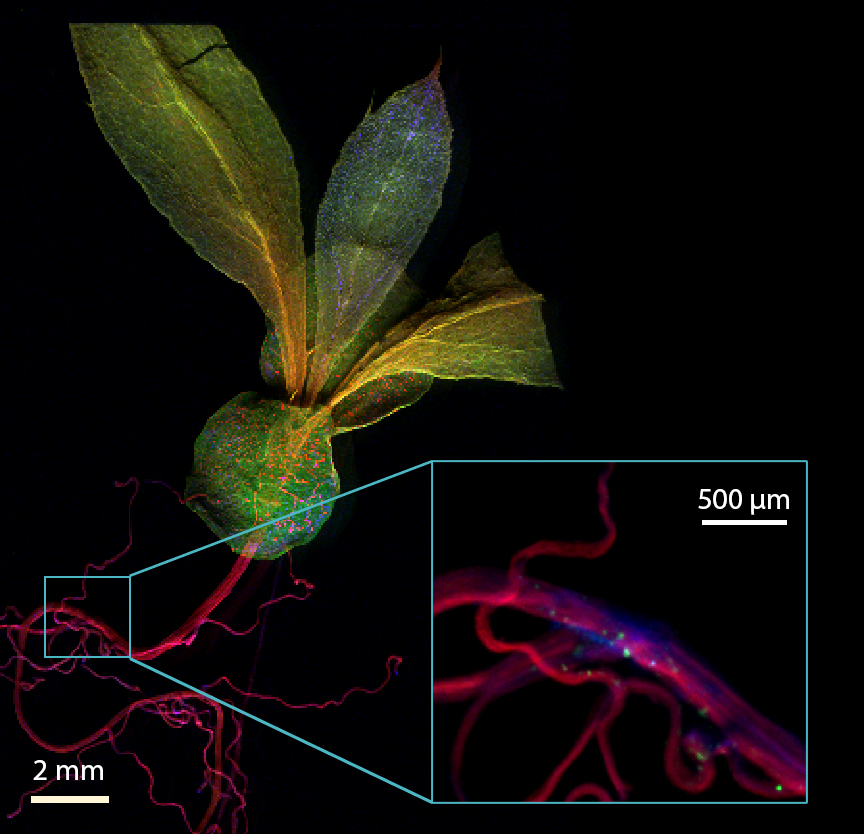
Hyperaccumulating seedling shown with K (red), Ni (blue), Cl (green) elements selected. Zoom-in of seedling roots shows trace uptake of Mn. Roots zoom-in shown with K (red), Ni (blue), Mn (green).
Courtesy of Dr. Antony van der Ent and Dr. Peter Erskine, The University of Queensland, Australia
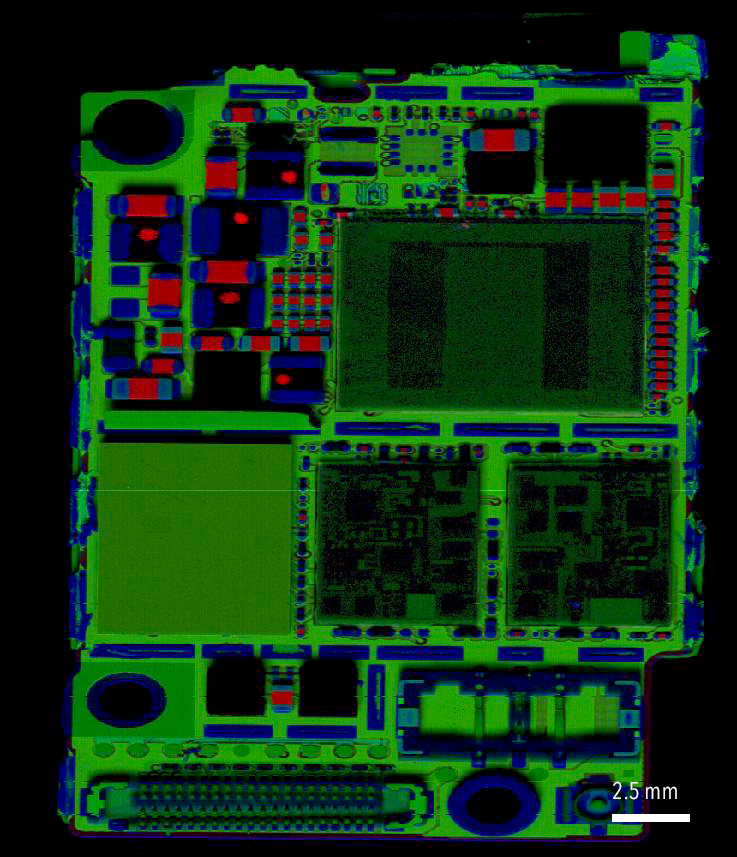
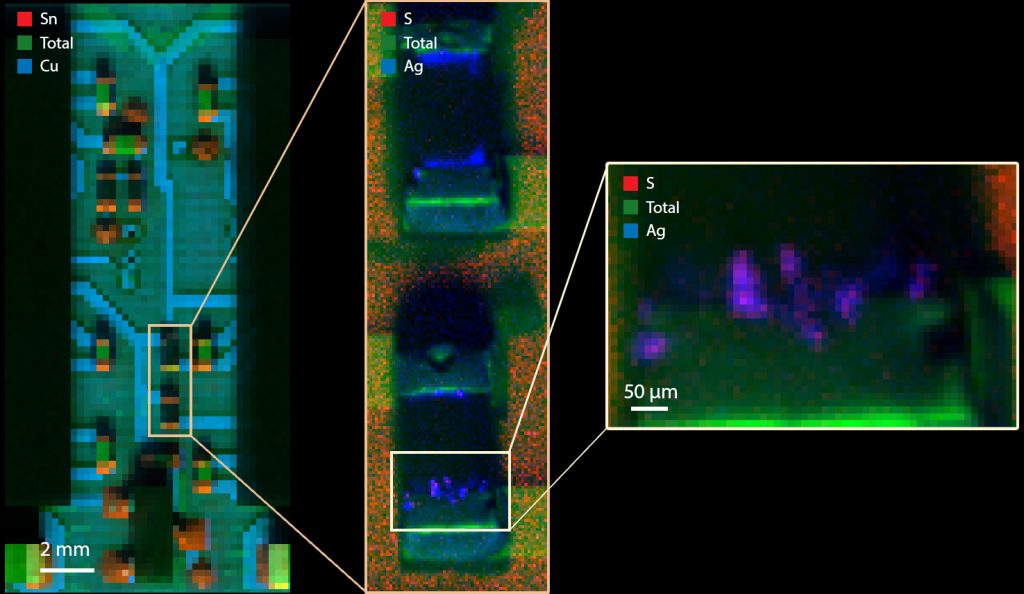
Phone chip with buried copper (green) layers visualized non-destructively, without removing the epoxy resin covering
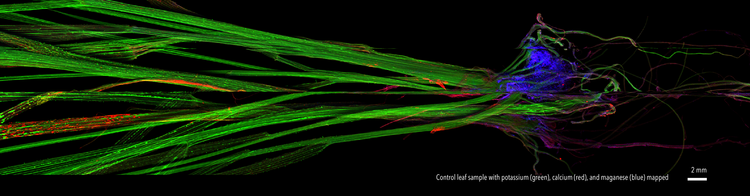
Control root sample with potassium (green), calcium (red), and manganese (blue) shown
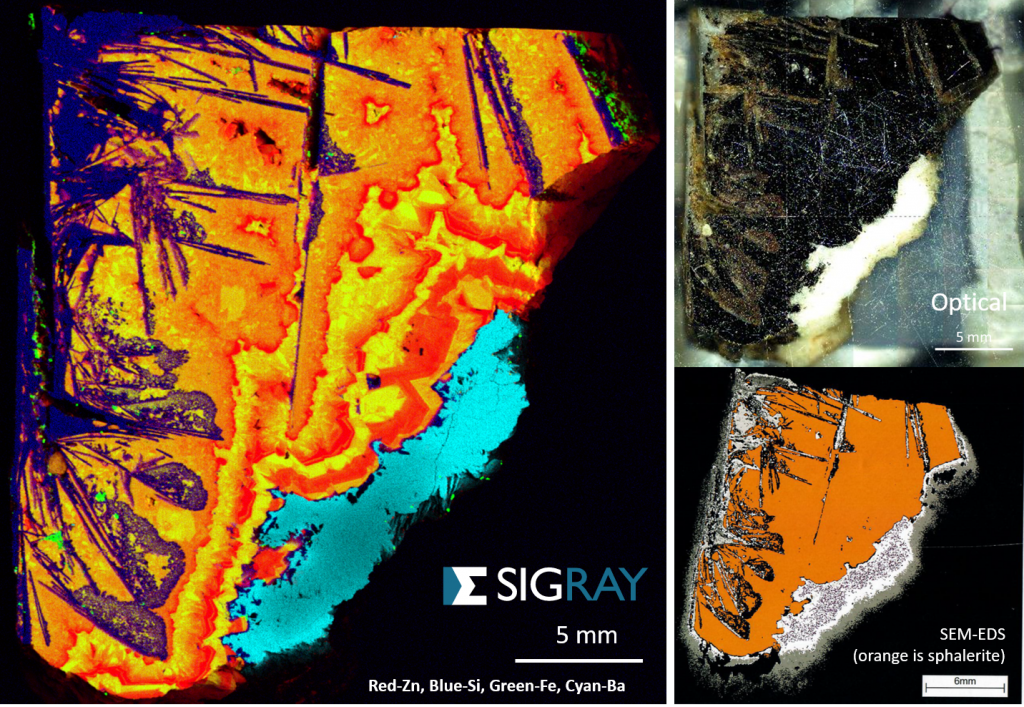
Courtesy of Dr. Dieter Rammlmair, BGR Institute for Geosciences and Natural Resources
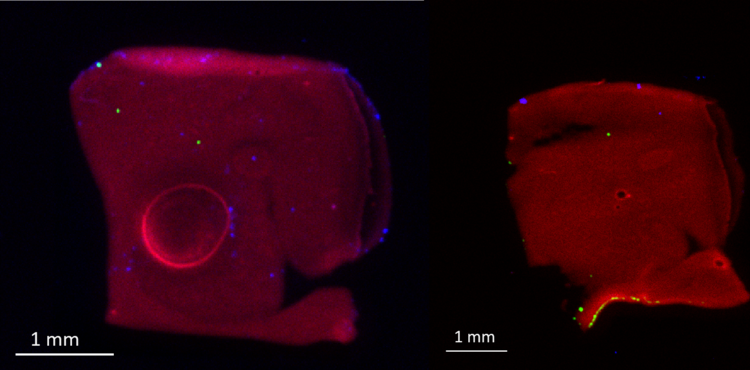
Mapping dysregulations of elements in Parkinson model mouse brain sections
Courtesy of Prof. Simon James and Dr. Erin MacAllum, Florey Institute of Neuroscience and Mental Health
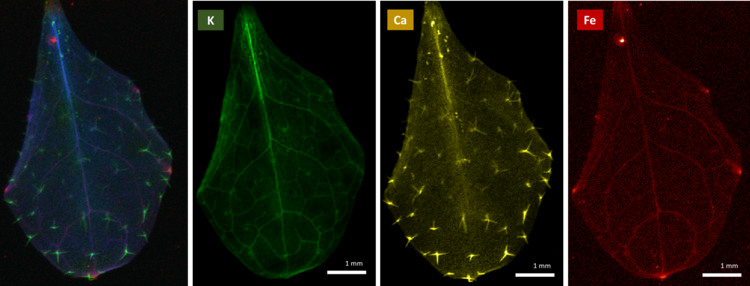
19-day leaf of a mutant OPT3 Arabidopsis plant, showing trace-level accumulation of iron (e.g. ug/cm^2)
Results comparable to previous runs on the synchrotron
Provided by Prof. Olena Vatamaniuk and Dr. Ju-Chen Chia, Cornell University
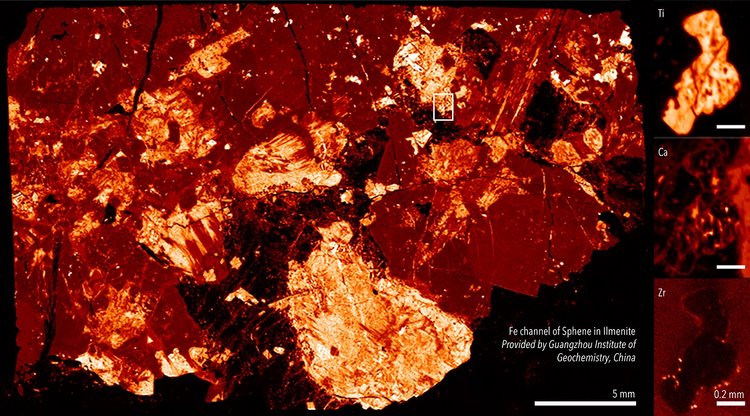
Fe channel shown in overview scan. A region of interest was identified and elements of interest (Zr, Ca, Ti) are shown.
Courtesy of Dr. Wei Tan, Guangzhou Institute of Geochemistry
Images taken from Sigray’s gallery. If you’d like to send in images of your results, please email OnlineTeam


