


High-End-Thermography with ImageIR® 8300 hp
Stress changes during tensile testing provide information about material properties of metals such as tensile strength. With the help of thermographic cameras metallic solid bodies can be tested for such stress changes.
Initial Situation
Numerous chemical and physical effects affect metals whereby their material properties such as tensile strength can change. Analyses on the degree of change are crucial for assessing whether or not a component or a complete device can still carry out its function without restriction. Tensile testing provides information for such assessments.
During this procedure external mechanical pressure is applied to solid state objects resulting in stress changes in their interior. The changed surface temperature is a parameter that describes the sum of all internal stress changes of the body which reach the surface. As a result of positive changes in pressure solid bodies heat up and cool down accordingly during negative changes in pressure. The inner stress change Δσ thus behaves directly proportional to the measured temperature change ΔT. The example of a test for tensile specimen measurement demonstrates that metallic solid bodies can be tested for such stress changes with the help of thermographic cameras.
Test Object
Two aluminium specimen with a typical shape for tensile testing are used for the analysis. These specimen are coated with a high infrared emitting varnish on one side.
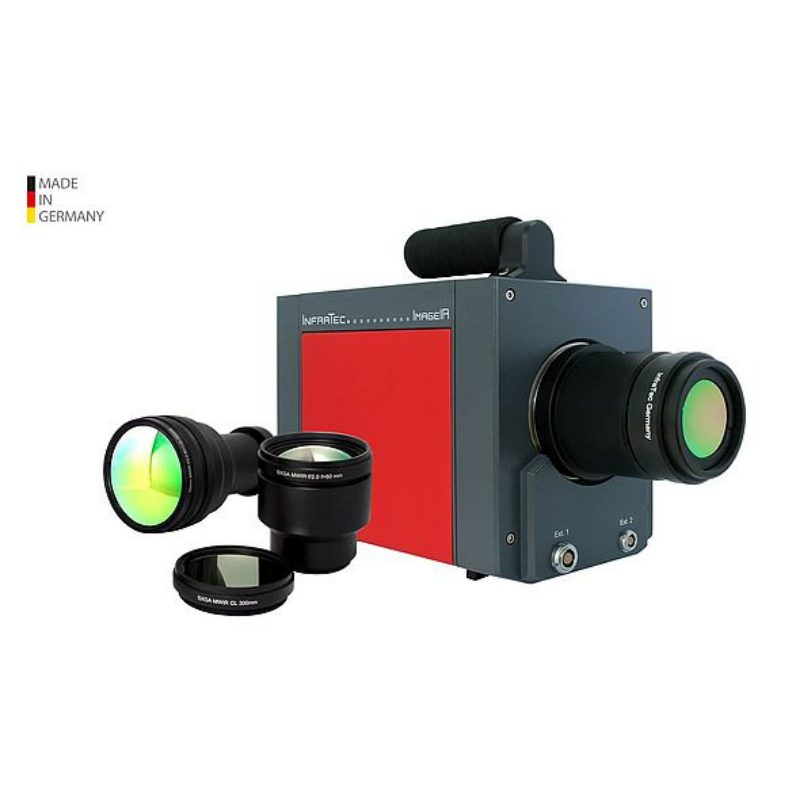
Testing Equipment
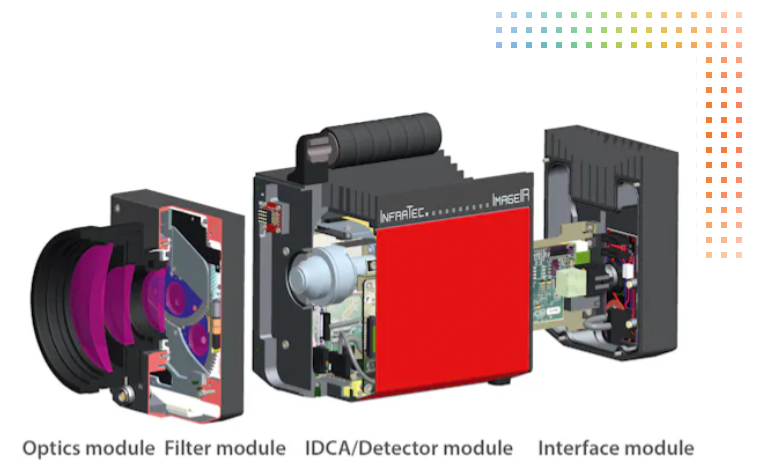
An ImageIR® 8300 hp with a 100 mm lens is used. The lens allows an adequate distance with a suitable image detail for small test objects. The camera which is equipped with a detector in the format of (640 x 512) IR pixels works in the sub-windowing mode to solve the task. With an image size of (320 x 256) IR pixels the image frame rate can be increased to the necessary 600 Hz. The corresponding data are captured with the software IRBIS® 3.1 professional and then analysed with the software IRBIS® 3 active.
Test Procedure
Clamped in a resonance tensile testing machine the samples are stretched periodically within their mechanical elastic range. During the entire procedure the ImageIR® 8300 hp acquires the surface temperature of the sample and sends the data in real time to a laptop for storage. In addition to the IR data an analogue signal of the tensile testing machine is also recorded. This signal corresponds to the current excitation frequency and its amplitude allows conclusions to be drawn as to the actual tensile force applied.
Results
Sample 1:
At the beginning of the test sample 1 is subjected to a static mechanical pre-stress of 2.25 kN. Afterwards, a periodically load was applied slowly increasing from zero to a signal of +/- 2.25 kN resulting in an absolute load between 0 and 4.5 kN to the sample. The excitation frequency is around 100 Hz and is dependent on the combination of sample and resonance tensile testing machine.
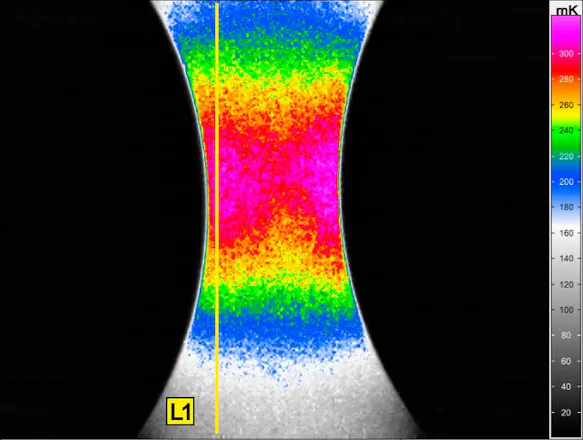
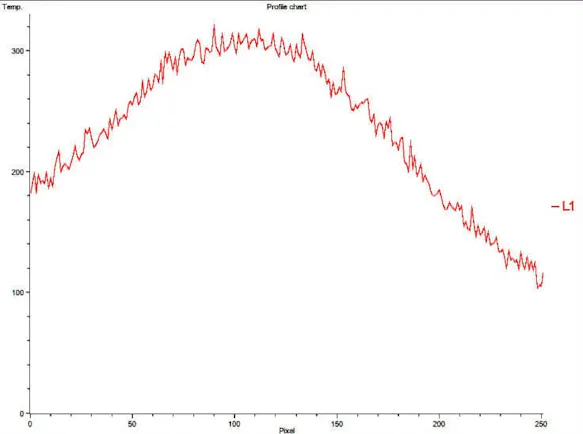
As expected the temperature profile shows an increase in temperature along the vertical sample axis at the narrowest region of the sample. However, significant temperature differences occur between the left and right side. Apparently, higher stress is built up on the left side.
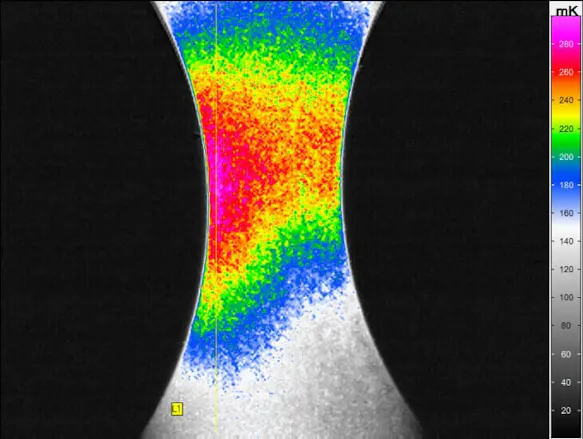
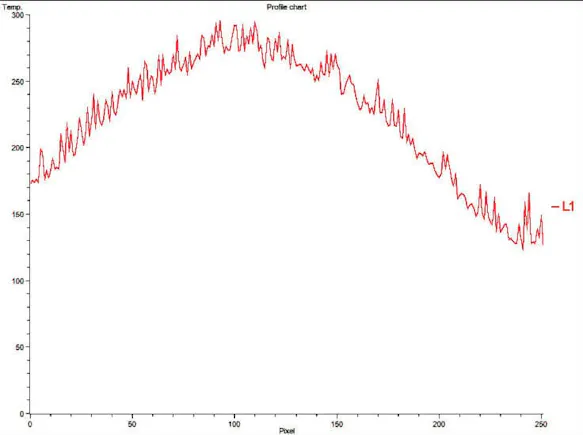
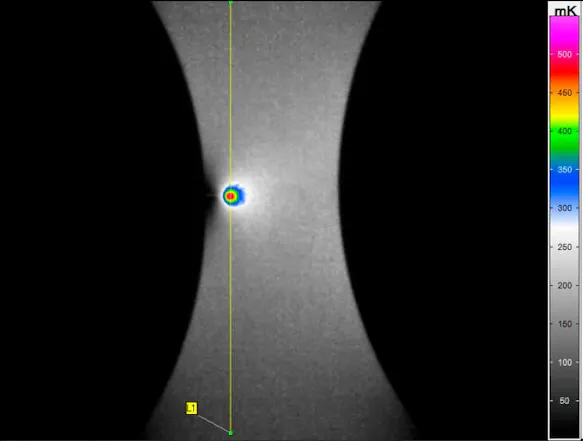
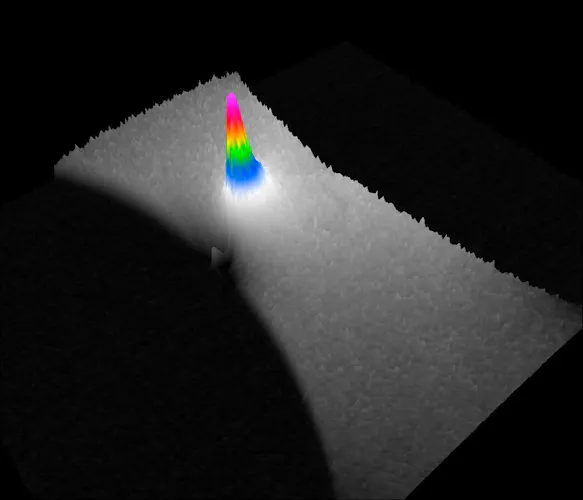
Lock-In amplitude image of sample 1. The asymmetric stress curve in the sample is clearly visible. At the bottom left the 3D visualisation is shown with the same scaling.
Sample 2:
The second sample has to withstand similar load conditions. However, the stress changes here periodically from the beginning with a signal of +/- 2.25 kN. Moreover the sample is loaded until breakage in this case. Overall, it seems to be more homogeneous compared with the first sample since the stress distribution appears more symmetrical. Just before the breakage a load peak occurred on the left edge within the narrowest region. During persisting load this peak shifts with the resulting crack further towards the middle of the sample. The changing stresses are reflected accordingly in the temperature changes with regard to the measurements.
Lock-In amplitude result of sample 2 at the start of the load cycle. A relatively symmetrical temperature (stress) distribution can be recognised over the sample cross-section. At the bottom left the 3D visualisation is shown with the same scaling.
With progressive breakage of sample 2 the stress peak shifts towards to the middle of the sample. On the right the 3D visualisation is shown with the same scaling.
Summary
Lock-In thermography is suitable for qualitative stress measurement both for the elastic stress range and for the transition to the plastic stress range. Using suitable formulas for the relationship of the temperature change to the stress change within the material quantitative results can certainly be calculated. Particularly in the case of poor heat conductors such as steel inhomogeneity within the material such as surface corrosion with considerable penetration depth and the associated material cross-section weaknesses can be recognised and their influence on the tensile strength determined.
The camera can be adapted to all requirements of the user due to modular design of the camera series ImageIR®. This means that a customer-specific thermography system is achieved in every direction. The ImageIR® can also be subsequently retrofitted or upgraded in the event of changing measurement requirements. In this way, maximum investment security is achieved.

Interested to learn more about stress analysis, the Infratec thermographic camera range and YOUR application?
Get in touch with our Technical Sales Manager, Dr. Luke Nicholls by email or call (01372) 378822.


