


Extend sample analysis from correlative bulk characterisations carried out with MPMS3 and PPMS to surface/nanoscale characterisation using FusionScope for correlative microscopy.
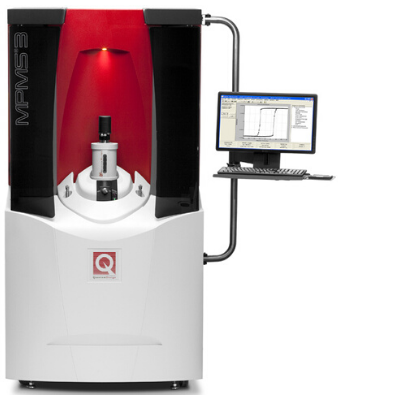
The ability to combine, and then correlate, multiple measurement techniques of a single sample is of paramount importance for physicists, chemists, and materials scientists. Doing so enables the investigator to fully understand, and potentially functionalise, the underlying physical mechanisms. The diverse suite of materials characterisation equipment offered by Quantum Design has, and continues to play, a significant role in facilitating these capabilities. For example, while Quantum Design’s first commercial measurement platform, the Magnetic Property Measurement System (MPMS®), was developed for high-sensitivity magnetic measurements, the capability to also measure the electric transport properties was soon added. This was of principal importance for researchers who needed to correlate the behaviour of the magnetic moment and electrical resistance of novel superconducting samples.
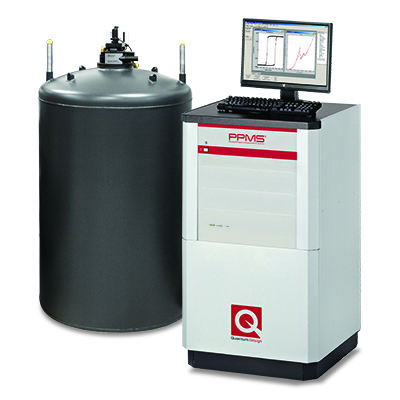
The more general Physical Property Measurement System (PPMS®) further expanded the experimental toolset to also include thermal (e.g., thermal conductivity and heat capacity) measurements over an even wider range of environmental (i.e., temperature and magnetic field) conditions. More recently, platforms such as OptiCool® have not only enabled various optical measurements, but also microscopy and the ability to probe material properties at the nanoscale. A recent paper [1] correlates the electrical photocurrent with scanning near-field optical microscopy (SNOM) of graphene at length scales less than 20 nm at low temperatures and high magnetic fields.
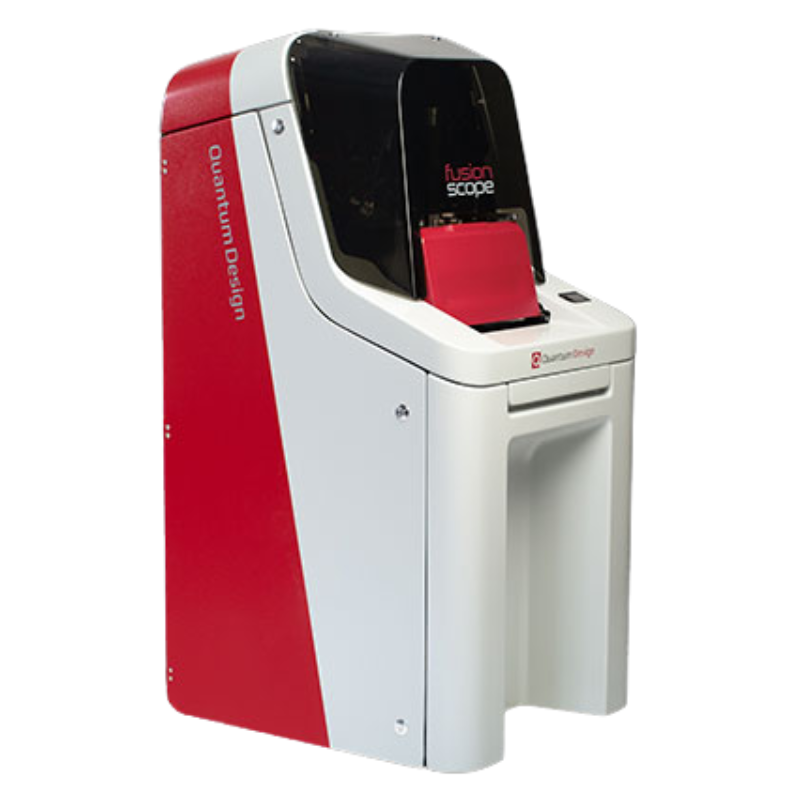
With the advent of FusionScope®, Quantum Design’s nearly 45-year history of facilitating easy-to-use equipment for correlative measurements, now includes a platform specifically designed for correlative microscopy. FusionScope combines the complementary strengths of atomic force microscopy (AFM), scanning electron microscopy (SEM), and elemental analysis via energy dispersive X-ray spectroscopy (EDS). When combined, the family of instruments offered by Quantum Design facilitate materials characterisation that not only spans a wide range of environmental parameters, but also length scales. More specifically, FusionScope bridges the gap between the typically bulk characterisations carried out by the MPMS and PPMS platforms and the surface/nanoscale characterisation that is often required for a thorough and complete analysis.
This Application Note presents a cross-platform analysis of artificial spin ice (ASI) [2] samples using the MPMS3, PPMS, and FusionScope.
The Sample
An ASI is a lithographically defined metamaterial assembled from periodic or sometimes aperiodic arrays of strongly interacting magnetic nanoislands, usually stadium shaped. Initially, the ASI provided a fruitful playground to study magnetic frustration in a highly degenerate ground state.
However, more recently, they have found potential applicability in next generation neuromorphic and reservoir computing schemes [3]. As the high frequency GHz dynamics of such ASIs can also be further functionalised, owing to e.g. their spin-wave band gaps, for a variety of magnonic applications a new class of reconfigurable magnonic crystal (RMC) has recently been realised [4]. The ASI samples for this Application Note were fabricated by standard electron-beam lithography and liftoff techniques. Extensive stitching enabled the fabrication of arrays spanning macroscopic lateral areas 1 cm2. To create these structures, Permalloy (Ni81Fe19) is thermally evaporated and capped with a thin 5 nm Al2O3 protective layer. The resulting ASI array, “Brickwork”, is shown below in Figure 1.

Figure 1: SEM image of the ASI “Brickwork”. Each element is nominally 600 nm x 200 nm and a Permalloy thickness of 40 nm.
Measurements
Major Hysteresis Loop: MPMS 3
The first step when characterising virtually any magnetic material is usually to measure a standard major hysteresis loop. The saturation moment, remanence, coercivity, and general shape provide many clues as to the magnetic reversal mechanisms present. The 10-8 emu sensitivity of the MPMS3 makes it an ideal choice for measuring such a patterned array. The major hysteresis loop for the ASI “Brickwork” is shown in Figure 2. The relatively large loop squareness (saturation moment/remanent moment=0.72) and sharp switching at the coercive field suggest a highly uniform, i.e. single domain, remanent state that undergoes a coherent reversal. It is important to remember, a major hysteresis loop, while a critical first step in the analysis, provides an ensemble average of the millions of individual elements and may obfuscate subtle details.

Figure 2: Major hysteresis loop measured with the MPMS 3.
First Order Reversal Curve (FORC): PPMS-VSM
The saturation moment of 7×10⁻⁵ emuissufficient to also perform FORC measurements using the vibrating sample magnetometer (VSM) option for the PPMS. More specifically, FORC measurements are performed to uncover further details of the magnetic reversal mechanisms. A comprehensive description of the FORC measurement technique would be too lengthy for this Application Note. If interested, the reader is invited to refer to [5] and [6]. In sum, FORC measurements consists of two parts: (1) the measurement of the FORCs and (2) the calculation of the FORC distribution based upon the measured FORCs. The measurement of a single FORC proceeds as follows: The applied magnetic field is first brought to a saturation field. From the saturation field, the applied field is then reduced to a given reversal field, HR. From this reversal field, the magnetic moment is then measured back towards positive saturation, thus tracing out a single FORC. This process is then repeated for incrementally smaller reversal fields until negative saturation is achieved, generating a family of FORCs, which should ideally fill the interior of the major hysteresis loop, Figure 3 (A). From this family of FORCs the FORC distribution, Figure 3 (B), is calculated, which provides a quantitative fingerprint of the magnetic reversal mechanisms.

Figure 3: (A) Family of FORCs used to calculate the FORC distribution shown in (B).
The resulting FORC distribution shown in Figure 3 (B), a simple highly localised ridge along the Hc-axis, is consistent with those observed in patterned magnetic arrays that reverse via a single domain rotation [7]. The spread along the Hc-axis provides a measure of the distribution of switching, i.e. coercive, fields present.
Magnetic Force Microscopy (MFM): FusionScope
While the major loop provides important metrics of the ensemble average, and FORCs can provide further clues as to reversal mechanisms and distributions of magnetic properties, only magnetic imaging, such as MFM, can provide a direct measure of the magnetic configurations at the nanoscale. Performing MFM with FusionScope comes with many benefits over more conventional systems, as described in more detail in this Application Note [8] . Succinctly put, the ability to tilt the sample and image the MFM tip with SEM, referred to as Profile View, not only allows one to precisely place the MFM tip, but also directly inspect the quality of the tip in situ, as demonstrated in Figure 4 (A). Sharp (tip radius <15 nm), high-aspect-ratio, Co3Fe tips are fabricated using focused electron beam-induced deposition (FEBID). Such tips, combined with the ability to work in vacuo, promote high lateral spatial resolution and phase contrast [9].
The phase contrast measured at a lift height of 35 nm is shown in Figure 4 (B). The white oval indicates a single element where two clear magnetic poles are observed at each end of the stadium, consistent with a highly uniformly magnetized single domain state. Each element is essentially behaving as a nanoscopic bar magnet. The stray field gradients, and therefore forces, are largest at the two poles where the MFM tip is either repelled or attracted, resulting in an opposing phase contrast. While the vast majority of elements show a similar dipolar contrast, a few, highlighted with yellow circles, show a more complex structure, that is perhaps indicating a multidomain state. Consistent with the major loop and FORC analysis, this multidomain phase is expected to be the minority, as observed with MFM.

Figure 4: (A) Profile view of the FEBID MFM tip in close proximity to the ‘Brickwork’ array. (B) A 5 μm x 5 μm MFM image. The vast majority of elements (typical example indicated by the white oval) show the expected dipole feature associated with a single domain at remanence. The yellow circles highlight a few exceptions where amultidomain state may be observed.
A high-resolution scan focusing on the intersection region between three elements is shown in Figure 5. The topography, Figure 5 (A), confirms the expected thickness of each element and the MFM phase contrast, Figure 5 (B), indicates the largest contrast is concentrated at the ends of the elements, as expected. The red/blue contrast can be interpreted as north and south poles, as the elements essentially behave as nanoscopic uniformly magnetised bar magnets. In the case of two neighbouring elements, the lowest magnetostatic energy state would be realised by ensuring opposite poles are near each other, i.e. north next to south. However, the energy landscape becomes more complicated with the placement of a third element as its orientation cannot simultaneously energetically satisfy its neighbours. This magnetic ‘frustration’ is a key to functionalising such ASI systems. Figure 5 (C) shows the variation of the phase traversing two opposite poles for the single line scan indicated in Figure 5 (B). Of particular note is the low noise observed in the phase signal, highlighting the exceptional performance of MFM in the FusionScope.

Figure 5: (A) Topography, (B) MFM phase contrast, and (C) the phase variation corresponding to the line scan shown in (B).
Random Array
As a final comparative example, an array of randomly oriented elements is studied, as shown in Figure 6. In addition to the now aperiodic array, the most notable change is that the Permalloy thickness has been significantly increased, Figure 6(E), compared to the periodic ‘Brickwork’ array, Figure 5 (A). This increased thickness will have significant consequences on the reversal mechanisms present, as already observed in the standard major hysteresis loop measured with the MPMS3, Figure6 (B). Note the reduced remanence and ‘wasp-waist’ loop as compared to that shown in Figure 2. Such a loop shape in patterned nanostructures often indicates reversal via magnetic vortex states [10] and [11]. This is further corroborated by the FORC analysis obtained with the PPMS-VSM, Figure 6(C) and Figure 6(D), which is also significantly different than that shown in Figure 3. The FORC distribution shown in Figure 6(D) is also reminiscent of that observed for vortex state reversal [12]. The FORC distribution shows two dominant features above and below the Hc-axis, which can be correlated with the vortex nucleation and annihilation fields. Vortex state reversal is only confirmed after performing MFM, Figure 6 (F), where clear vortex and probable double-vortex states are observed.

Figure 6: (A) Profile view of the FEBID MFM tip in close proximity to the random array. (B) Corresponding major hysteresis loop measured with the MPMS 3. The family of FORCs (C) used to generate the corresponding FORC distribution shown in (D). (E) Topography and (F) MFM.
Concluding Remarks
The FusionScope represents a natural continuation and extension of the materials characterization instrumentation Quantum Design is known for. The ability to correlate the electrical, thermal, and magnetic properties of novel materials has been a staple of the MPMS and PPMS platforms for decades. In this Application Note the static magnetic properties, i.e. major hysteresis loops, FORCs, and MFM are the primary focus. While outside of the scope of this Application Note, broadband ferromagnetic resonance (FMR) measurements are also possible on such ASI arrays within the PPMS platform and provide a quantitative ‘fingerprint’ of the nanoscale dynamics [13]. Whereas the MPMS and PPMS typically measure the average behaviour of an ensemble, the FusionScope enables measurements of surfaces with nanoscale resolution.
References [1] M. Dapolito, M. Tsuneto, W. Zheng, L. Wehmeier, S. Xu, X. Chen, J. Sun, Z. Du, Y. Shao, R. Jing, S. Zhang, A. Bercher, Y. Dong, D. Halbertal, V. Ravindran, Z. Zhou, M. Petrovic, A. Gozar, G. L. Carr, Q. Li, A. B. Kuzmenko, M. M. Fogler, D. N. Basov, X. Du, and M. Liu, Infrared nanoimaging of Dirac magnetoexcitons in graphene. Nat. Nanotechnol., 18, 1409 (2023). https://doi.org/10.1038/s41565-023-01488-y [2] R.F. Wang, C. Nisolil, R.S. Fretas, J. Li, W. McConville, B.J. Cooley, M.S. Lund, N. Sarmarth, C. Leighton, V.H. Crespi, and P. Schiffer, Artificial ‘spin ice’ in a geometrically frustrated lattice of nanoscale ferromagnetic islands, Nature 439, 303 (2006). https://doi.org/10.1038/nature04447 [3] K. D Stenning, J. C. Gartside, L. Manneschi, C. T. S. Cheung, T. Chen, A. Vanstone, J. Love, H. Holder, F. Caravelli, H. Kurebayashi, K. Everschor-Sitte, E. Vasilaki, and W. R. Branford, Neuromorphic overparameterisation and few-shot learning in multilayer physical neural networks, Nature Comm. 15, 7377 (2024). https://doi.org/10.1038/s41467-024-50633-1 [4] J. C. Gartside, A. Vanstone, T. Dion, K. D. Stenning, D. M. Arroo, H. Kurebayashi, and W. R. Branford, Reconfigurable magnonic modehybridisation and spectral control in a bicomponent artificial spin ice, Nature Comm. 12, 2488 (2021). https://doi.org/10.1038/s41467-021-22723-x [5] C. R. Pike and A. Fernandez, An investigation of magnetic reversal in submicron-scale Co dots using first order reversal curve diagrams, J. Appl. Phys. 85, 6668 (1999). https://doi.org/10.1063/1.370177 [6] R. K. Dumas, C. P. Li, I. V. Roshchin, I. K. Schuller, and K. Liu, Magnetic fingerprints of sub-100 nm Fe dots, Phys. Rev. B 75, 134405 (2007). https://doi.org/10.1103/PhysRevB.75.134405 [7] See reference [6]. [8] MFMApplication Note 1081-215 [9] See reference [8]. [10] T. Shinjo, T. Okuno, R. Hassdorf, K. Shigeto, and T. Ono, Magnetic Vortex Core Observation in Circular Dots of Permalloy, Science 289, 930 (2000). DOI: 10.1126/science.289.5481.930 [11] R. P. Cowburn, D. K. Koltsov, A. O. Adeyeye, M. E. Welland, and D. M. Tricker, Single-Domain Circular Nanomagnets, Phys. Rev. Lett. 83, 1042 (1999). https://doi.org/10.1103/PhysRevLett.83.1042 [12] See reference [6]. [13] A. Vanstone, J. C. Gartside, K. D. Stenning, T. Dion, D. M. Arroo, and W. R. Branford, Spectral fingerprinting: microstate readout via remanence ferromagnetic resonance in artificial spin ice, New. J. Phys. 24, 043017 (2022). DOI 10.1088/1367-2630/ac608b


